


Seasonal Weakness in US Stocks During July Options Expirations | Jeff Hirsch
The NASDAQ has declined in 23 of the past 35 years during this week, with an average loss of 0.46%, including seven consecutive down years most recently...

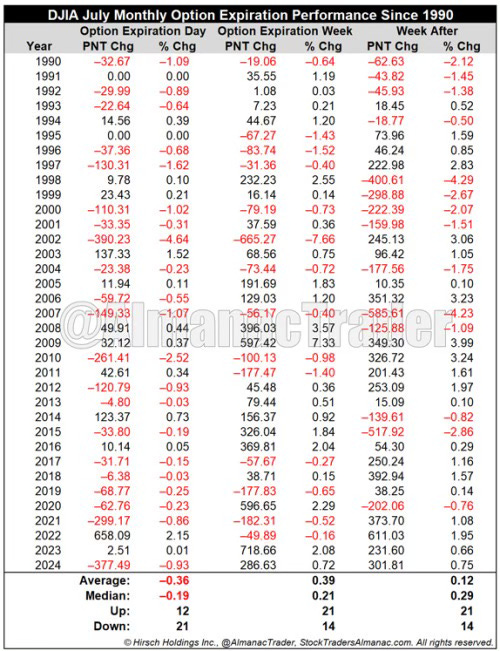
Since 1990, the Friday of July’s monthly options expiration week has shown a bearish bias for the DJIA, which declined 21 times in 35 years, with two unchanged years—1991 and 1995. On that Friday, the average loss is 0.36% for the DJIA and 0.35% for the S&P 500.
The NASDAQ has declined in 23 of the past 35 years during this week, with an average loss of 0.46%, including seven consecutive down years most recently. This trend suggests a potential seasonal bearish pattern likely linked to options trading dynamics.
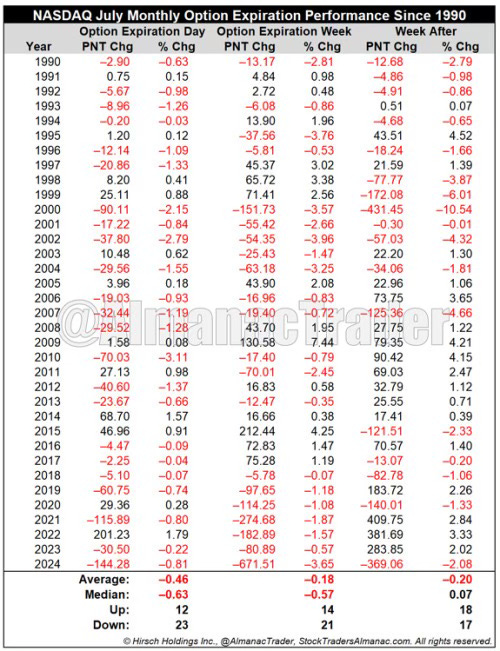
For the full week, the DJIA posts the best performance, rising in 21 of 35 years with an average gain of 0.39%. However, the NASDAQ has been the weakest, declining in 21 years—including the last seven consecutively—with an average loss of 0.18%.
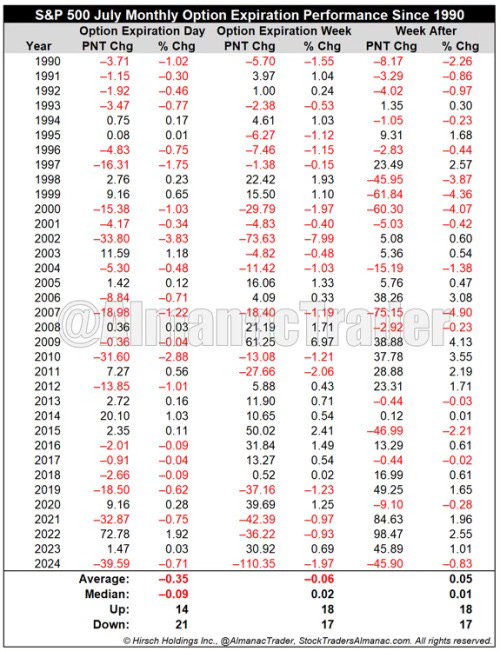
The week following monthly options expiration also tends to be bearish for the NASDAQ, which averages a loss, compared to mild gains for the DJIA and S&P 500.
Reference:
Jeffrey A. Hirsch (July 11, 2025) - July Monthly Options Expiration Week – NASDAQ Down 7 Straight.
See also:
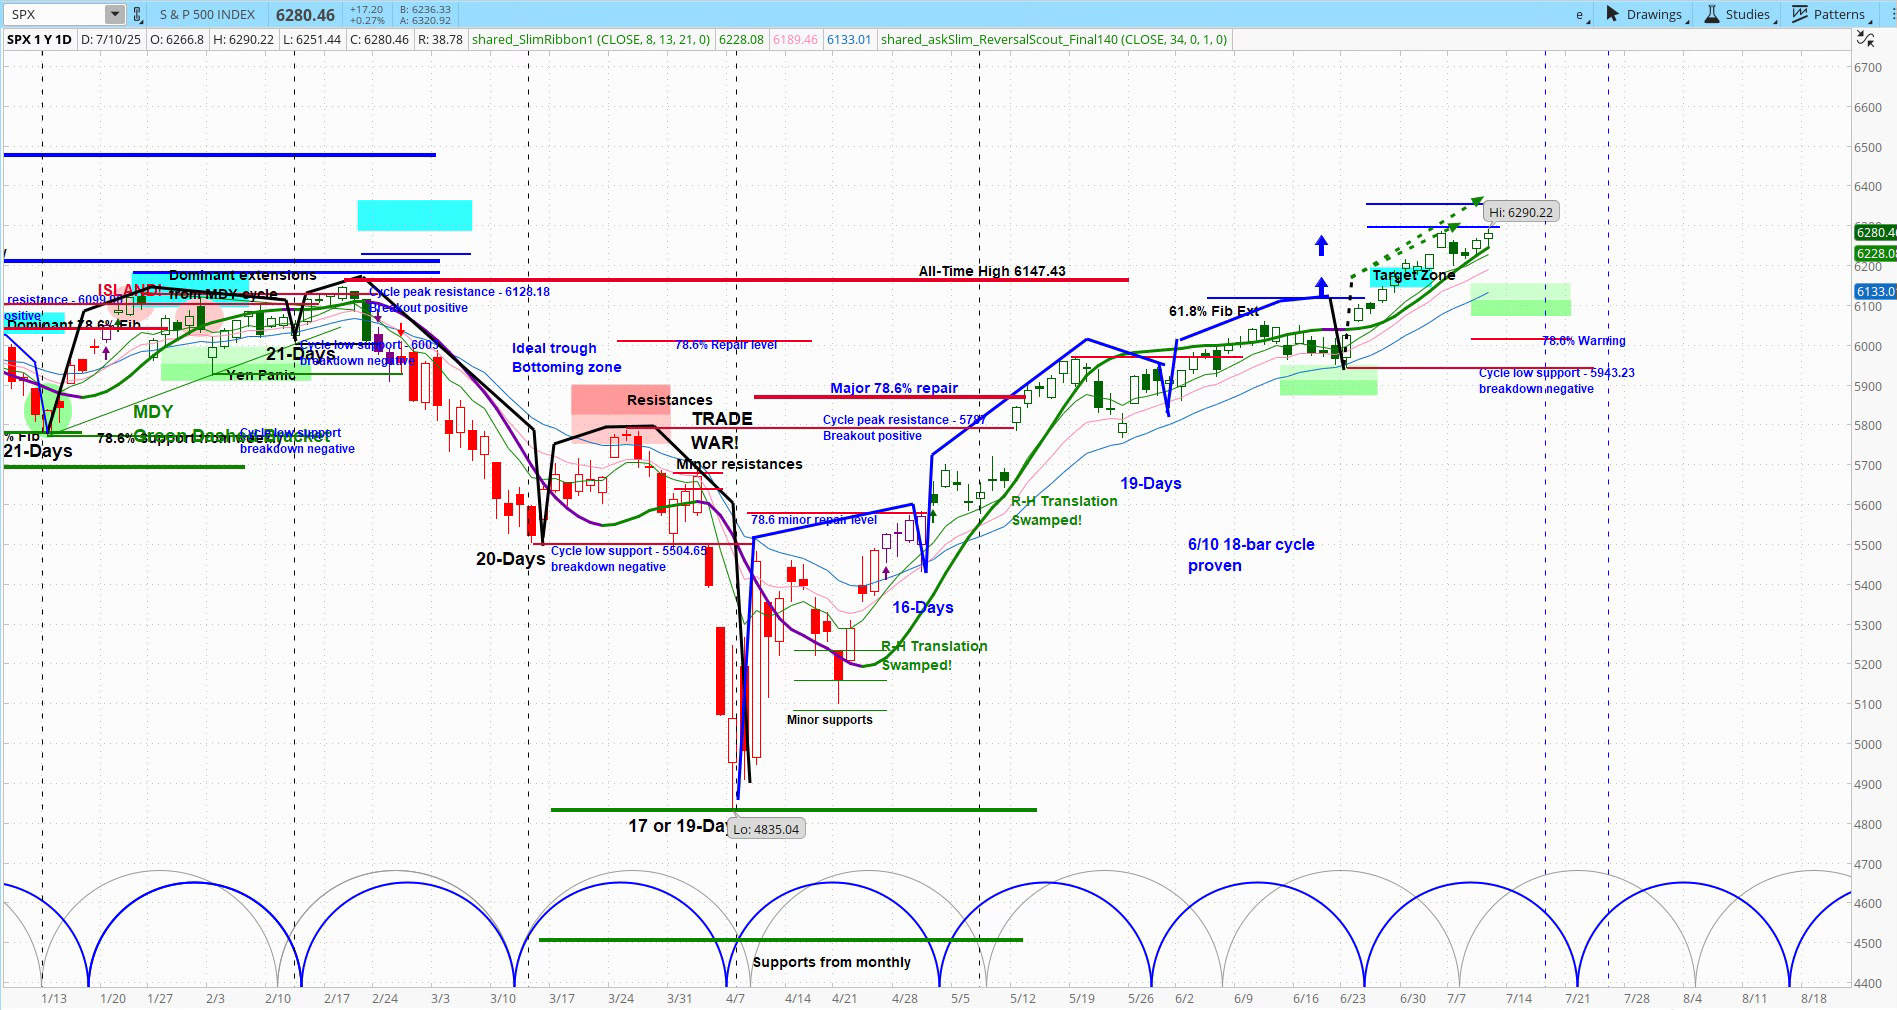
Krasi (July 12, 2025) - S&P 500 Hurst Cycles Analysis.
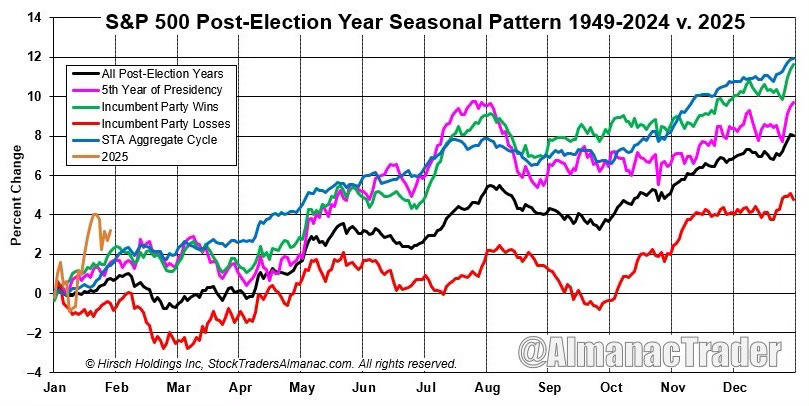
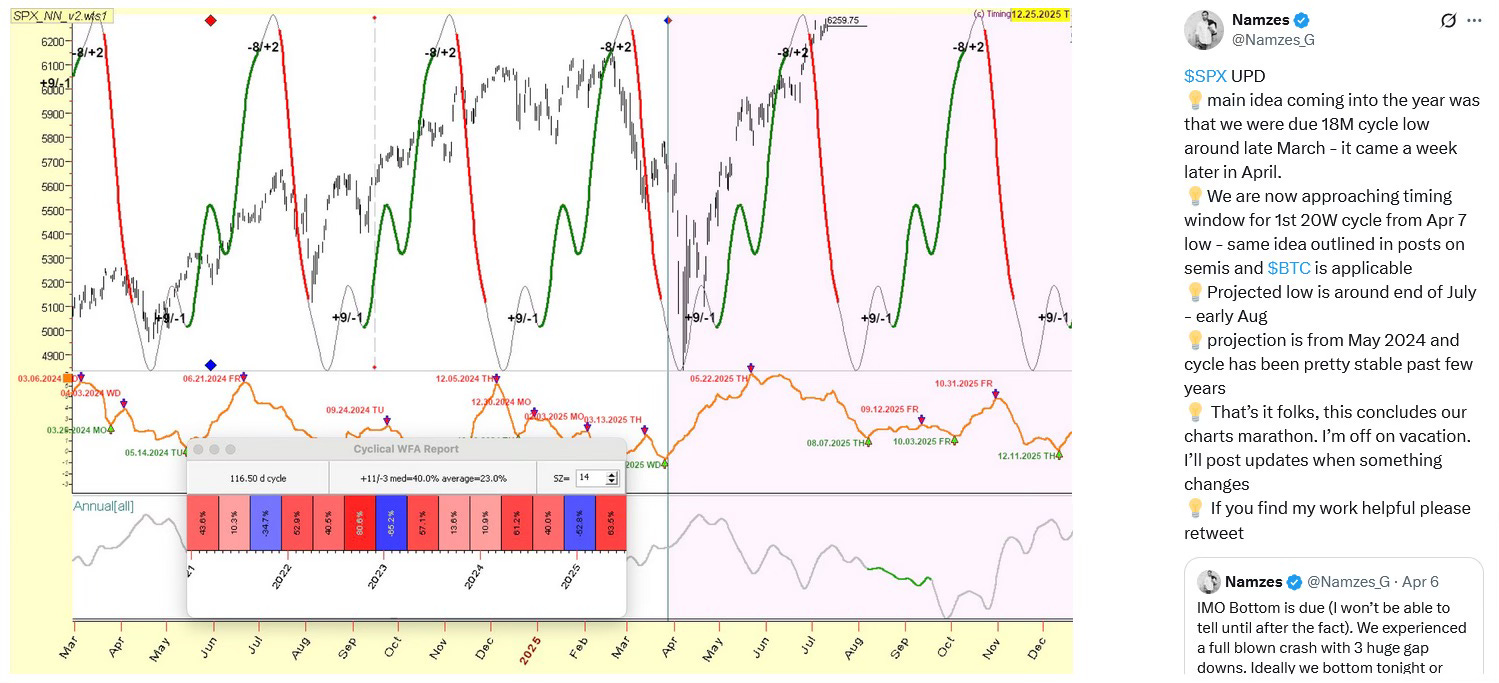
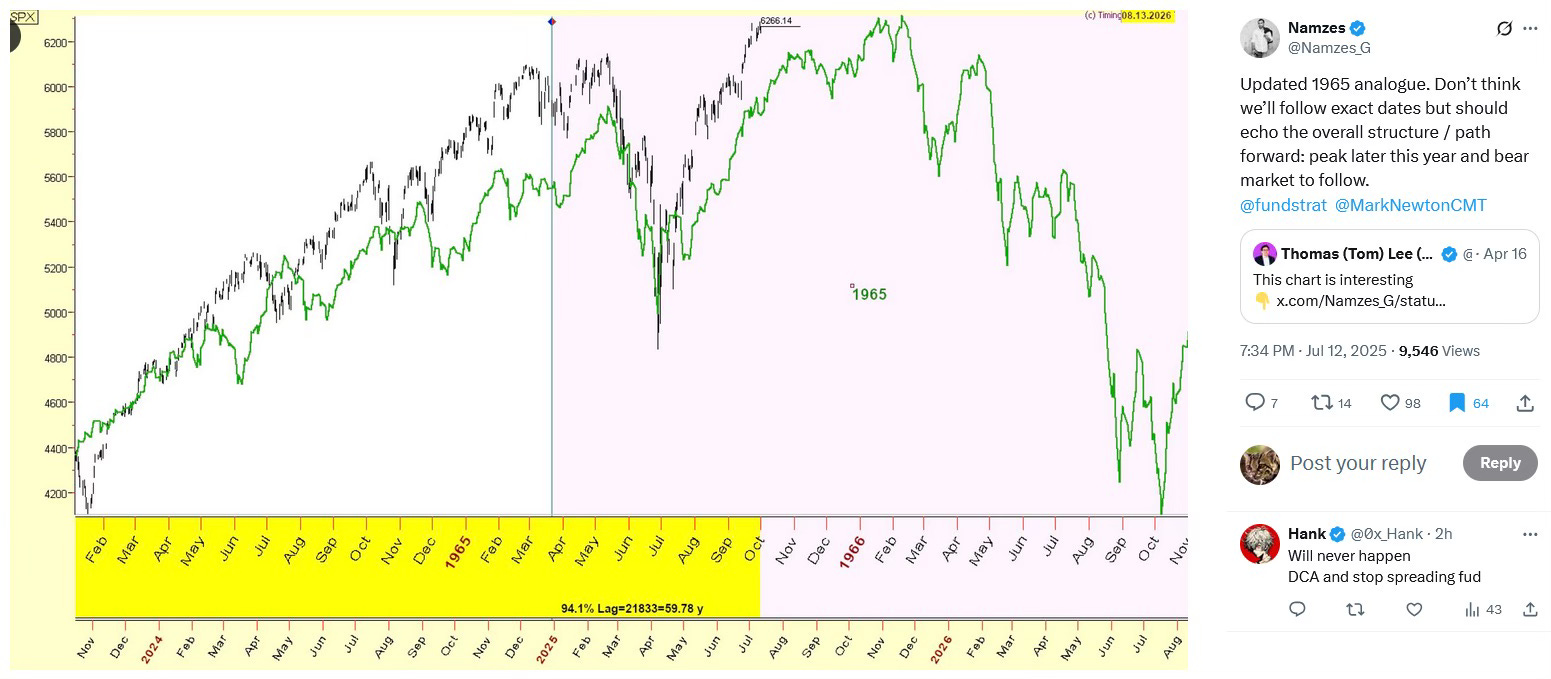
Labels: 4 Year Cycle, Branimir Vojcic, Data Mining, Jeffrey A. Hirsch, Namzes, Post-Election Year Pattern, Presidential Cycle, S&P 500 Index, Seasonality,Steve Miller, US-Stocks
Financial Markets & Universal Law is a reader-supported publication. To receive new posts and support my work, consider becoming a free or paid subscriber.