
VIX Cycles: Forecasting Volatility Peaks Through 2032 | Branimir Vojcic
Currently, the composite cycle signal forecasts a multi-year cyclical peak in 2032, a period which may correspond to a significant low in the stock market...
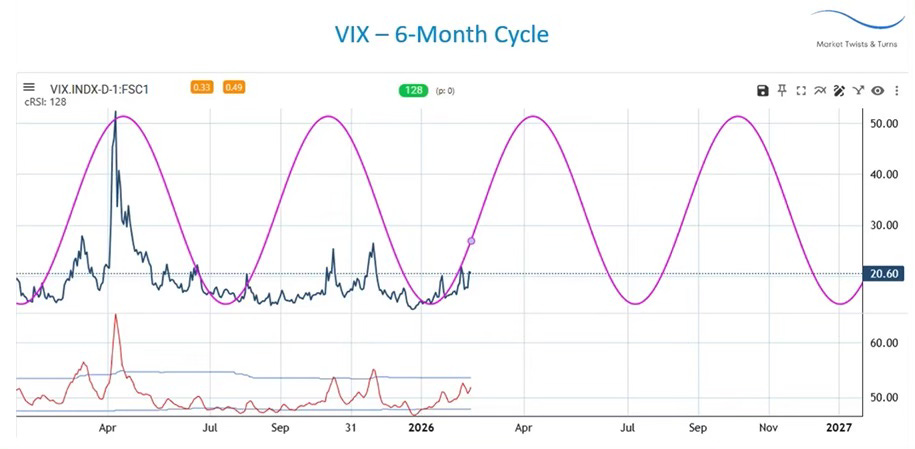
Seasonality within the Standard & Poor’s 500 Volatility Index (VIX) indicates that volatility typically rises toward the spring, declines during the summer months, and ascends once more in October. Chart 1 illustrates the six-month cycle that dominates the daily timeframe, aligning closely with established VIX seasonality patterns.
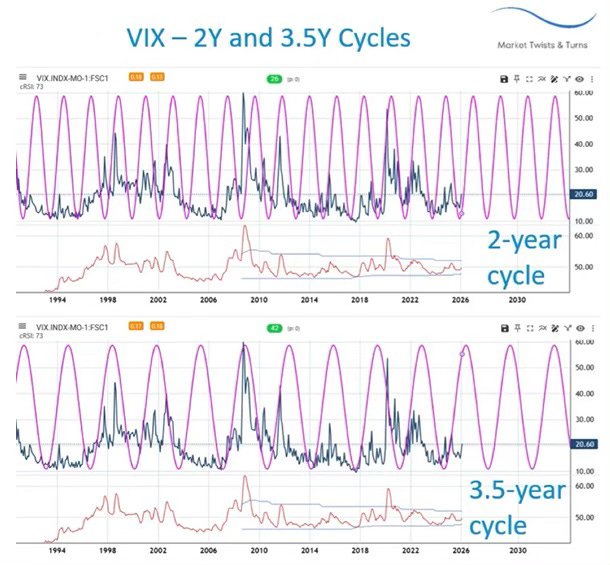
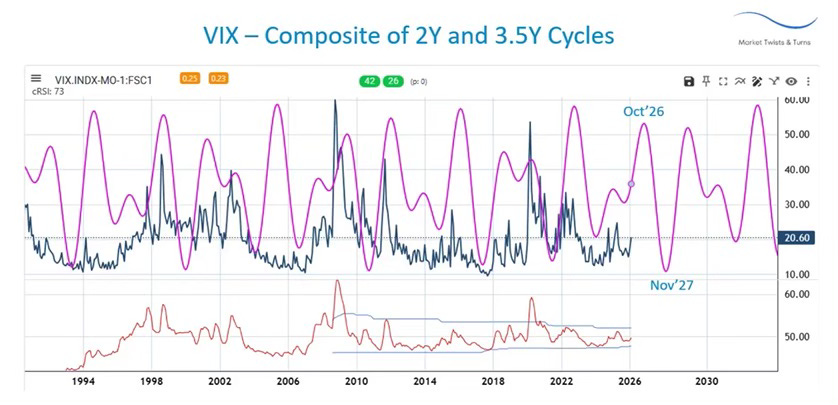
Shifting our focus to longer-duration significant cycles, we examine the two-year and 3.5-year cycles (Chart 2). The latter is formally recognized as the Kitchin cycle and is observable across numerous financial markets. Although these two powerful cycles are frequently out of phase, they generally succeed in capturing significant spikes within the VIX. By combining them (Chart 3), we yield a composite cycle signal; we observe that these two cycles capture the majority of the VIX’s historical movements, notwithstanding a notable failure in 2005.
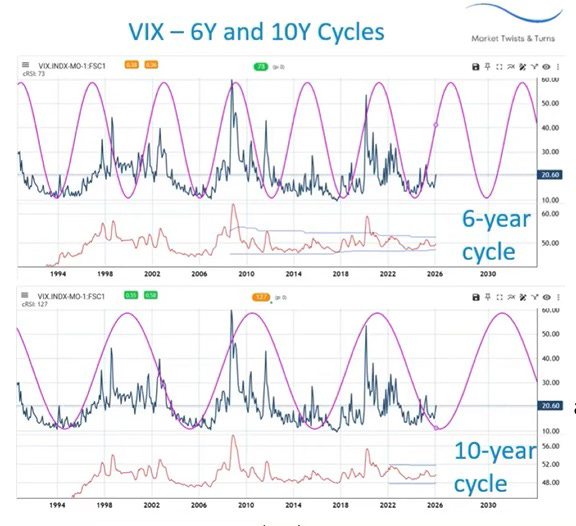
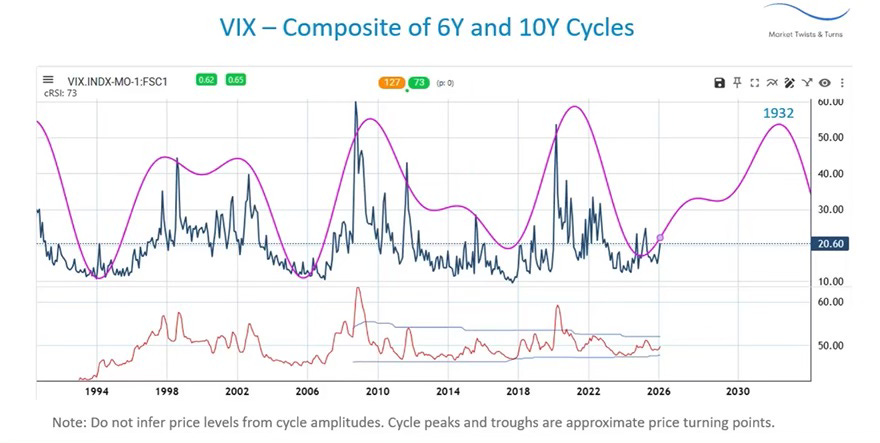
Naturally, various other cycles—both of shorter and longer durations—simultaneously influence price action. On the monthly VIX chart, the six-year and ten-year cycles are the dominant forces, beautifully capturing multi-year fluctuations (Chart 4). It is important to note that both of these cycles reached troughs in 2005, which explains why the shorter-term cycles were unable to produce a volatility spike during that period.
The integration of these two cycles further underscores their critical importance for long-term VIX trajectories. Currently, the composite cycle signal forecasts a multi-year cyclical peak in 2032, a period which may correspond to a significant low in the stock market. Finally, by incorporating the two-year and 3.5-year cycles, we add essential granularity to the composite of these very long-term cycles (Chart 5).
The next significant cycle peak and trough are estimated to occur in November of 2026 and throughout 2027, respectively. Following that inflection point, the VIX will generally maintain an upside bias toward 2032. Given that stock market movements are typically inversely correlated with those of the VIX, does this imply that the equity market will decline through October 2026, rally in 2027, and subsequently enter a secular bear market until the early 2030s?
Reference:
Branimir Vojcic (February 16, 2026) - What Message is Volatility (VIX) Sending? Part 1 & Part 2. (videos)
Posted by Time-Price-Research at Monday, February 23, 2026
Email ThisBlogThis!Share to XShare to FacebookShare to Pinterest
Labels: 10-Year Cycle, 54-Month Cycle, 6-Year Cycle, Branimir Vojcic, Cycles, Kitchin Cycle, Position Trading, Spectrum Cycle Analysis, VIX, Volatility
Financial Markets & Universal Law is a reader-supported publication. To receive new posts and support my work, consider becoming a free or paid subscriber.